Visual Analysis
Advertisement
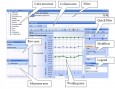
RadarCube WPF OLAP Grid and Chart v.1.30.0
A set of WPF controls (OLAP Grid and OLAP Chart) to add OLAP and Visual Analysis functionality to your WPF applications. OLAP Grid displays data in an interactive pivot table and OLAP Chart shows the same data in charts and graphs.
Advertisement
Data Desk v.6 1
Data Desk brings fast, easy-to-use visual analysis to your desktop. It provides interactive graphical tools for exploring and understanding your data-for finding the patterns, relationships, and exceptions.
OLAPCharts for SharePoint v.2010
Interactive OLAP Charts for SharePoint 2010 provides SharePoint web parts for charting and visual analysis of your OLAP cube data. Easy to set up, and integrate in your existing SharePoint sites.

DIVA
DIVA - Database Immersive Visual Analysis: a viewer for databases physical structure that can show you any section of DB in different ways (2D, 2.5D, 3D). Using DIVA users can easily understand connections between tables. It's compatible with: Oracle,
ORIMA v.10.0
ORIMA is an LPS add-on providing advanced aerial triangulation and visual analysis tools.
DView v.1 25
DView displays hourly time series data in a variety of formats. DView for NREL helps you with the visual analysis of all kinds of hourly time series data, with a particular emphasis on 'typical meteorological year' data.
CvMob v.3.0.3
CvMob is an Open Source tool to automatic visual analysis of human movement. The program calculates the optical flow to generate data about trajectory, velocity and acceleration using low-quality videos.
RadarCube ASP.NET OLAP control for MS Analysis v.1 23
RadarCube is a fast and powerful ASP.NET OLAP control providing you with a unique chance of supplying the web site with the MS Analysis 2000 or 2005 client abilities. It is entirely authored in C# 2.
RadarCube OLAP Chart Windows Forms v.2.50.0
NET Windows Forms OLAP controls (both Grid and Chart) to add Visual OLAP Analysis to your applications. Displays business data in charts and graphs rather than in numbers. Works with a relational database or MS Analysis Services.
S&A - Traffic Jam Layout v.1 5
Traffic Jam Layout is specifically developed by S&A to optimize the arrangement of temporal charts with many theme lines and many links. This Layout was originally developed to perform telephone calls analysis, in conjunction with TETRAS by S&A.
ADVIZOR Analyst/X Office v.5.8.1.39654
With Analyst Office™ business managers and analysts can easily load data, do analysis, and share results within minutes - and all they need is a mouse!